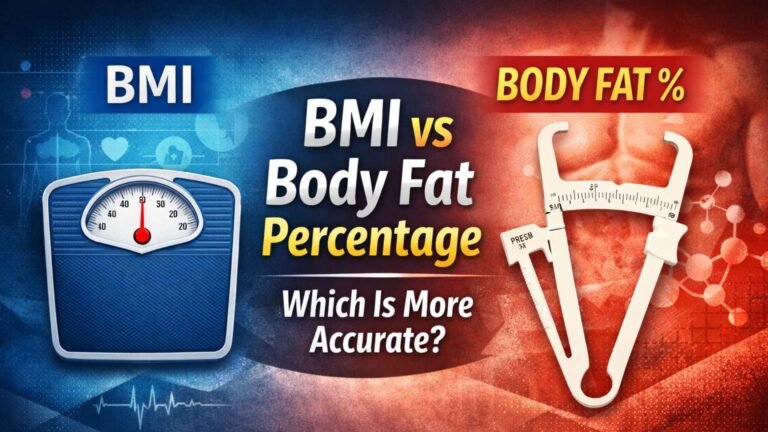
BMI vs Body Fat Percentage: Which Is More Accurate?
Your doctor says your BMI is normal. Your body fat scanner says you’re borderline obese. Which one do you trust?
This is not a rare scenario. Millions of people receive conflicting signals from these two metrics every year — and the confusion costs them real health outcomes. BMI is fast and free. Body fat percentage is harder to measure but tells a very different story.
This article breaks down exactly what each metric measures, where each one fails, and which one you should actually use to make decisions about your health. No filler — just what you need to know.
What Is BMI and How Is It Calculated?
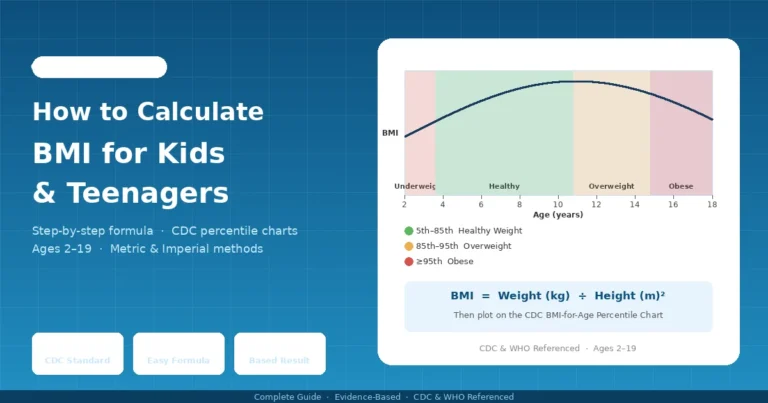
BMI (Body Mass Index) is a simple ratio of your weight in kilograms divided by your height in meters squared (kg/m²). It was designed in the 1830s by Belgian mathematician Adolphe Quetelet — not as a medical tool, but as a way to study population weight trends at scale.
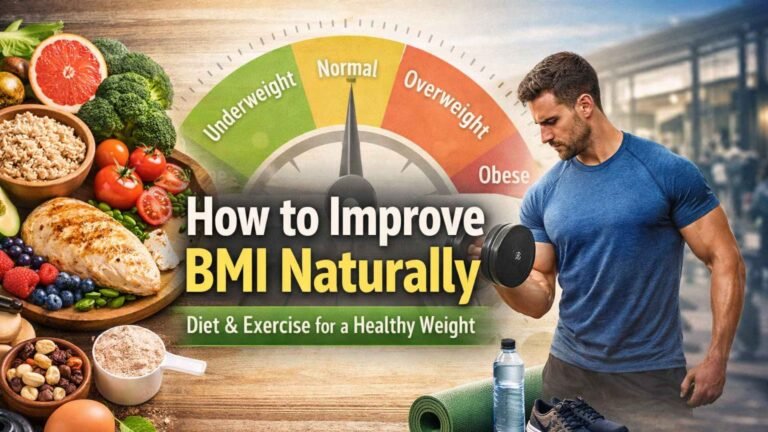
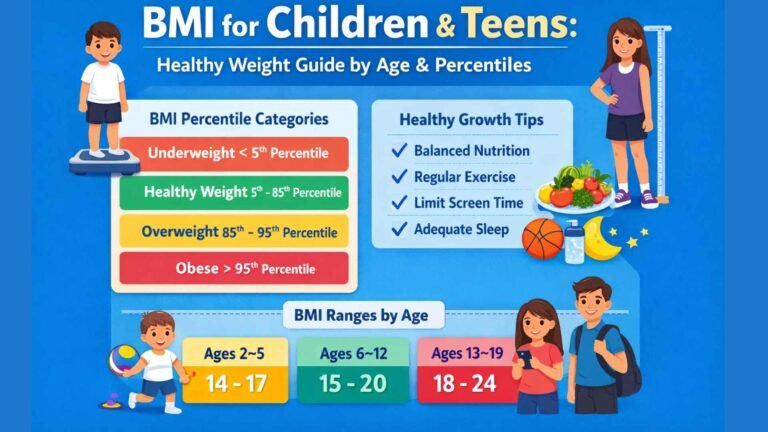
The four standard BMI categories used by the WHO are:
| BMI Range | Classification |
|---|---|
| Below 18.5 | Underweight |
| 18.5 – 24.9 | Normal weight |
| 25.0 – 29.9 | Overweight |
| 30.0 and above | Obese |
The formula is genuinely simple. You can calculate your BMI in 10 seconds with a calculator. No equipment, no cost, no appointment needed. That simplicity is the entire reason it became the default health screening tool in clinics worldwide.
But Quetelet himself never intended this formula for clinical use. He was building population statistics, not diagnosing individuals. That distinction matters enormously — and it’s where BMI’s biggest problem begins.
What Is Body Fat Percentage and Why Does It Matter?
Body fat percentage measures how much of your total body weight is fat mass, expressed as a percentage. A person weighing 80 kg with 20 kg of fat has a body fat percentage of 25%. BMI can’t tell you that. A scale can’t tell you that either.
Healthy body fat ranges vary by sex and age. The American Council on Exercise (ACE) identifies these general benchmarks:
| Category | Women | Men |
|---|---|---|
| Essential fat | 10–13% | 2–5% |
| Athletes | 14–20% | 6–13% |
| Fitness | 21–24% | 14–17% |
| Acceptable | 25–31% | 18–24% |
| Obese | 32%+ | 25%+ |
This is the number that actually describes your body’s composition. Two people can have the same BMI of 27 and have body fat percentages of 18% and 34% respectively — which puts them in completely different health risk categories. BMI cannot see this difference. Body fat percentage can.
How to Measure Body Fat Percentage Accurately
There is no single perfect method, but some are far more reliable than others. Here are the main options ranked from most to least accurate:
1. DEXA Scan (Dual-Energy X-ray Absorptiometry) The current gold standard. A DEXA scan uses low-dose X-rays to differentiate between bone mineral, lean mass, and fat mass throughout the entire body. Accuracy is typically within 1–3% of true body fat. Cost ranges from $50–$150 per scan at specialist clinics. This is what serious athletes and clinical researchers use.
2. Hydrostatic (Underwater) Weighing You are weighed both in and out of water. Because fat is less dense than muscle and bone, the difference calculates body density and from that, body fat percentage. Highly accurate but rare and inconvenient — very few facilities offer it outside sports science labs.
3. BOD POD (Air Displacement Plethysmography) Same principle as hydrostatic weighing but uses air displacement instead of water. Accurate within 1–3%, faster, and more accessible. Often found at universities and performance centers.
4. Skinfold Calipers A trained technician pinches fat at multiple sites on the body (typically 3–7 sites) and uses the measurements in a formula. Accuracy depends heavily on technician skill. When done correctly by an experienced professional, it can be within 3–5%. When done poorly — which is common — results drift significantly.
5. Bioelectrical Impedance Analysis (BIA) Most consumer body fat scales use this method. A small electrical current passes through the body; fat resists it more than muscle does. Results can vary by up to 8–10% depending on hydration, time of day, and what you ate. Consumer BIA devices are convenient but unreliable for precision tracking. Clinical-grade BIA machines used by doctors are more consistent.
6. The U.S. Navy Method (Tape Measurement Formula) Uses neck and waist circumference (and for women, hip circumference) in a validated formula. Free, fast, and surprisingly accurate — within 3–4% when measurements are taken correctly. It is used by the U.S. military as a practical screening tool.
For most people without access to a DEXA scanner, combining the Navy tape method with a high-quality BIA reading over time gives a useful picture of trends, even if absolute numbers aren’t perfect.
Why BMI Gets It Wrong — The Evidence
BMI’s core limitation is structural: it measures weight, not composition. Muscle is denser than fat. A professional athlete with 8% body fat and significant muscle mass will have a higher BMI than a sedentary person of the same height who carries most of their weight as fat.
This isn’t a theoretical edge case. It’s common.
A 2016 study published in the International Journal of Obesity, led by researchers at UCLA, analyzed cardiometabolic health data for over 40,000 adults and found that BMI misclassified the health status of approximately 74.6 million Americans. That includes people labeled “healthy” who had metabolic abnormalities, and people labeled “unhealthy” who showed no cardiometabolic risk factors at all.
The researchers found that nearly half of people classified as “overweight” by BMI were metabolically healthy, while nearly 30 million people classified as “normal weight” had poor cardiometabolic profiles. BMI missed them entirely.
This phenomenon has a clinical name: TOFI — Thin Outside, Fat Inside — coined by Professor Jimmy Bell at Imperial College London. These are individuals who appear lean and have a normal BMI, but carry dangerous levels of visceral fat around their organs. Research from Imperial College has shown that visceral fat — not subcutaneous fat — is the stronger driver of insulin resistance, cardiovascular disease, and type 2 diabetes.
BMI cannot see visceral fat. Body fat percentage methods, particularly DEXA scans, can.
Other documented BMI blind spots:
- Age: Older adults naturally lose muscle mass.The same BMI at 65 represents a much higher body fat percentage than at 30.
- Ethnicity: Research consistently shows that people of Asian descent face significantly elevated cardiometabolic risk at BMI levels that are considered “normal” in Western populations. The WHO now recommends adjusted cut-off points for Asian populations (overweight at BMI 23, obese at BMI 27.5).
- Sex: Women naturally carry more body fat than men at identical BMIs. A woman and a man with the same BMI of 24 have very different body compositions.
- Height extremes: BMI systematically overestimates risk in very tall people and underestimates risk in very short people — a mathematical quirk of the formula itself.
BMI vs Body Fat Percentage: Side-by-Side Comparison
| Factor | BMI | Body Fat % |
|---|---|---|
| What it measures | Weight-to-height ratio | Actual fat vs lean mass |
| Cost | Free | $0 (tape) to $150 (DEXA) |
| Accuracy | Low for individuals | Moderate to very high |
| Distinguishes muscle from fat | No | Yes |
| Detects visceral fat | No | Partially (DEXA: yes) |
| Accounts for sex | No | Yes |
| Accounts for age | No | Yes (with adjusted ranges) |
| Useful for populations | Yes | No (too complex at scale) |
| Useful for individuals | Limited | Yes |
| Required equipment | None | Varies by method |
| Risk of misclassification | High | Low to moderate |
Common Myths About BMI and Body Fat
Myth 1: “A normal BMI means you’re healthy.” Not reliably. As covered above, millions of people with normal BMIs have metabolic dysfunction, elevated visceral fat, and real cardiovascular risk. BMI is a population-level filter, not an individual health certificate.
Myth 2: “Body fat scales from the pharmacy are accurate enough.” Consumer BIA devices are notoriously inconsistent. In one study, the same person tested on multiple consumer BIA scales received readings ranging from 22% to 34% body fat on the same day. They are useful only for spotting long-term directional trends — not for precise snapshots.
Myth 3: “Athletes always have low BMIs.” The opposite is often true. Many professional athletes, particularly rugby players, NFL linemen, and weightlifters, register as “overweight” or “obese” on the BMI scale despite having body fat percentages well below 15%. Using BMI to screen athletes for health risks is essentially useless.
Myth 4: “Losing weight always improves body composition.” Not necessarily. Crash diets often cause muscle loss alongside fat loss. Someone who drops 5 kg of weight on a very low-calorie diet may actually see their body fat percentage stay the same or even rise if they lose more muscle than fat. Tracking body fat percentage — not just weight — catches this.
Myth 5: “Body fat percentage is too complicated to track.” With the Navy tape method and a free online calculator, you can estimate body fat in under three minutes using only a measuring tape. It is not as intimidating as it sounds.
Frequently Asked Questions
What is a healthy body fat percentage for women? For women, a healthy body fat percentage generally falls between 21–31%, depending on age. Athletes typically sit at 14–20%, while below 10–13% is considered essential fat — below this, hormonal and bone health risks increase. These ranges shift slightly as women age, with higher ranges considered acceptable after 50.
What is a healthy body fat percentage for men? For men, a healthy range is approximately 18–24%. Athletes typically fall between 6–13%. Essential fat for men is 2–5%. Going significantly below essential fat levels disrupts hormone production, immune function, and organ protection.
Can I have a normal BMI but still be unhealthy? Yes — and it is more common than most people realize. People with normal BMI but high visceral fat are often described as “metabolically obese, normal weight” (MONW). They carry the same cardiometabolic risk as people classified as obese, but BMI doesn’t flag them. Body fat percentage testing — especially DEXA — will reveal what BMI hides.
Which body fat measurement method is most accurate at home? The U.S. Navy tape method is the most reliable no-cost option at home. You need only a flexible measuring tape and an online calculator. For a step up in accuracy without clinical costs, a mid-range BIA scale (from brands with clinical validation, such as Tanita or InBody home units) can track trends effectively when used consistently under the same conditions — first thing in the morning, before eating or drinking.
Should I use BMI or body fat percentage to track my fitness progress? For tracking personal fitness progress, body fat percentage is far more useful. BMI cannot distinguish between a 2 kg muscle gain and a 2 kg fat gain — they look identical on the scale and produce the same BMI reading. Body fat percentage captures the actual change in your composition, which is what matters for health and performance outcomes.
Is BMI completely useless? Not entirely. For large-scale public health research and population screening, BMI remains practical because it requires no equipment and can be calculated instantly for any individual in a dataset. For tracking trends in obesity rates across a country or region, it functions adequately. Where it fails is at the individual level — making health judgments about a single person based solely on their BMI is unreliable.
Does ethnicity affect how I should interpret my BMI? Yes, significantly. Research shows that South Asian, East Asian, and Southeast Asian individuals face higher metabolic risk at lower BMI thresholds than populations used to set the original WHO standards. The WHO now recommends that BMI cut-offs for Asian populations should sit at 23 for overweight and 27.5 for obese. If you are of Asian descent, discuss adjusted thresholds with your physician.
How often should I measure my body fat percentage? For most people, measuring body fat percentage every 4–8 weeks is sufficient. Body composition changes slowly — daily or weekly measurements create noise rather than signal. If you are actively training and adjusting your diet, monthly measurements give you enough data to assess whether your approach is working.
The Bottom Line: Which Metric Should You Actually Use?
BMI is a screening tool designed for populations. Body fat percentage is an assessment tool designed for individuals. They answer different questions, and the mistake most people make is using BMI to answer a question it was never built to answer.
If your goal is to understand your personal health risk, track your fitness progress, or make informed decisions about diet and exercise — body fat percentage is the more accurate and more meaningful metric. The Navy tape method costs nothing and takes three minutes. A DEXA scan gives you the complete picture for less than the cost of a monthly gym membership.
BMI has a role: it is a fast flag that says “further investigation may be warranted.” It should never be the final answer about anyone’s health. It was never meant to be.
Your action step: Measure your body fat percentage using the Navy tape method today — the formula is free on any government health site or fitness calculator. Then compare that number to the ACE ranges by sex and age. You will have a more honest picture of where you stand than any BMI chart has ever given you.
This article is intended as an independent educational guide. It does not constitute medical advice. Consult a qualified healthcare professional before making changes to your diet, exercise, or treatment plan based on body composition measurements.
Explore fresh content that brings value—start reading and surge forward with renewed purpose.